JACKSON, Miss., Feb. 9, 2021 /PRNewswire/ --
![]()
Fourth Quarter 2020 Results
Year 2020 Results
EastGroup Properties, Inc. (NYSE: EGP) (the "Company", "we", "us" or "EastGroup") announced today the results of its operations for the three and twelve months ended December 31, 2020.
Commenting on EastGroup's performance, Marshall Loeb, CEO, stated, "Our team and portfolio's performance exceeded our expectations not only for the quarter, but also for the year. We finished 2020 with FFO per share above our original pre-COVID forecast and begin 2021 at a record high percentage leased all while in the midst of a global pandemic. Now we are beginning to feel like the markets may ease to a sense of normalcy over the course of the year. With that stability and accompanying improved economic predictability, our optimism further rises, primarily due to the pandemic's acceleration of a number of positive trends within our industry and markets."
EARNINGS PER SHARE
Three Months Ended December 31, 2020
On a diluted per share basis, earnings per common share ("EPS") were $0.94 for the three months ended December 31, 2020, compared to $1.28 for the same period of 2019. The Company's property net operating income ("PNOI") increased by $4,570,000 ($0.12 per share) for the three months ended December 31, 2020, as compared to the same period of 2019. EastGroup recognized gains on sales of real estate investments of $13,145,000 ($0.33 per share) during the three months ended December 31, 2020, compared to $29,662,000 ($0.77 per share) during the same period of 2019. In addition, depreciation and amortization expense increased by $2,989,000 ($0.08 per share) during the three months ended December 31, 2020, as compared to the same period of 2019.
Twelve Months Ended December 31, 2020
Diluted EPS for the twelve months ended December 31, 2020 were $2.76 compared to $3.24 for the same period of 2019. PNOI increased by $21,792,000 ($0.55 per share) for the twelve months ended December 31, 2020, as compared to the same period of 2019. EastGroup recognized gains on sales of real estate investments of $13,145,000 ($0.33 per share) during the twelve months ended December 31, 2020, compared to $41,068,000 ($1.09 per share) during the same period of 2019. Depreciation and amortization expense increased by $11,635,000 ($0.30 per share) during the twelve months ended December 31, 2020, as compared to the same period of 2019.
FUNDS FROM OPERATIONS AND PROPERTY NET OPERATING INCOME
Three Months Ended December 31, 2020
For the three months ended December 31, 2020, funds from operations attributable to common stockholders ("FFO") were $1.38 per share compared to $1.27 per share for the same quarter of 2019, an increase of 8.7%.
PNOI increased by $4,570,000, or 7.3%, during the three months ended December 31, 2020, compared to the same period of 2019. PNOI increased $3,814,000 from newly developed and value-add properties, $839,000 from same property operations (based on the same property pool) and $631,000 from 2019 and 2020 acquisitions; PNOI decreased $695,000 from operating properties sold in 2019 and 2020.
The same property pool PNOI Excluding Income from Lease Terminations increased 2.0% on a straight-line basis for the three months ended December 31, 2020, compared to the same quarter in 2019; on a cash basis (excluding straight-line rent adjustments and amortization of above/below market rent intangibles), Same PNOI increased 2.2%. The Company has included in rental income deferred rent charges for executed deferral agreements that qualify for the modified COVID-19-related guidance provided by the Financial Accounting Standards Board ("FASB"); this rental income is also included in calculations for same property metrics. Additional information on the Company's deferred rent agreements may be found in the Impact of the COVID-19 Pandemic section below.
On a straight-line basis, rental rates on new and renewal leases (3.4% of total square footage) increased an average of 15.4% during the three months ended December 31, 2020.
Twelve Months Ended December 31, 2020
FFO for the twelve months ended December 31, 2020 was $5.38 per share compared to $4.98 per share during the same period of 2019, an increase of 8.0%.
PNOI increased by $21,792,000, or 9.1%, during the twelve months ended December 31, 2020, compared to the same period of 2019. PNOI increased $15,941,000 from newly developed and value-add properties, $5,505,000 from 2019 and 2020 acquisitions and $4,062,000 from same property operations (based on the same property pool); PNOI decreased $3,706,000 from operating properties sold in 2019 and 2020.
The same property pool PNOI Excluding Income from Lease Terminations increased 2.1% on a straight-line basis for the twelve months ended December 31, 2020, compared to the same period of 2019; on a cash basis (excluding straight-line rent adjustments and amortization of above/below market rent intangibles), Same PNOI increased 3.2%. The Company has included in rental income deferred rent charges for executed deferral agreements that qualify for the modified COVID-19-related guidance provided by the FASB; this rental income is also included in calculations for same property metrics. Additional information on the Company's deferred rent agreements may be found in the Impact of the COVID-19 Pandemic section below.
On a straight-line basis, rental rates on new and renewal leases (18.5% of total square footage) increased an average of 21.7% during the twelve months ended December 31, 2020.
The same property pool for the three and twelve months ended December 31, 2020 includes properties which were included in the operating portfolio for the entire period from January 1, 2019 through December 31, 2020; this pool is comprised of properties containing 38,612,000 square feet.
FFO, PNOI and Same PNOI are non-GAAP financial measures, which are defined under Definitions later in this release. Reconciliations of Net Income to PNOI and Same PNOI, and Net Income Attributable to EastGroup Properties, Inc. Common Stockholders to FFO are presented in the attached schedule "Reconciliations of GAAP to Non-GAAP Measures."
IMPACT OF THE COVID-19 PANDEMIC
On March 11, 2020, the World Health Organization characterized COVID-19 as a pandemic. Global, national and local economies continue to be impacted by the pandemic and the mitigation efforts to combat the spread of COVID-19.
During the course of the COVID-19 pandemic, the United States has experienced, and may continue to experience, significant health, social and economic impacts from COVID-19. EastGroup's operations, occupancy and rent collections have remained stable during this period. As of February 8, 2021, the Company has received rent relief requests, primarily in the form of payment deferral requests, from approximately 28% of its customers. These requests have largely ended; for comparison, this is only a slight increase from 26% at the end of April 2020 during the beginning of the pandemic. To date, approximately 18% of these requests have been granted some form of relief, which represents approximately 5% of the Company's customers on a square foot basis. The Company has executed rent deferral agreements totaling $1.7 million, which represents 0.4% of the Company's 2020 revenue. The deferrals all relate to 2020 rental income with no future period deferred rents. The terms differ for each deferral agreement, and all deferred rent payments that were due through December 31, 2020 have been collected with the exception of $27,000. As of February 8, 2021, 56% of total deferred rent has been collected. Under modified COVID-19-related guidance provided by the FASB, rental income for the majority of these deferral agreements ($1.4 million of the $1.7 million) qualifies to be recognized as rental income in the periods in which it was charged under the original terms of the leases. When requests were made, they were handled on a case-by-case basis, and the Company's responses were dependent on its understanding of the financial strength of the customer, the operational and earnings impacts being experienced by the customer, and the customer's ability or inability to obtain capital through debt or equity issuances, government assistance programs or by other means. Through February 8, 2021, rent payment deferrals and other forms of rent relief have not been material. The Company is continuing to actively monitor the evolving situation and its impact on the Company's cash flows and operations.
As of February 8, 2021, the Company's rent collection and rent payment deferral status was as follows:
|
Period |
% of Rent Collected (1) |
% of Uncollected |
% of Uncollected |
|||||||||||||||||
|
Quarterly |
||||||||||||||||||||
|
Q1 2020 |
99.8% |
0.0% |
0.2% |
|||||||||||||||||
|
Q2 2020 |
99.5% |
0.3% |
0.2% |
|||||||||||||||||
|
Q3 2020 |
99.4% |
0.3% |
0.3% |
|||||||||||||||||
|
Q4 2020 |
99.5% |
0.1% |
0.4% |
|||||||||||||||||
|
Monthly |
||||||||||||||||||||
|
October 2020 |
99.3% |
0.2% |
0.5% |
|||||||||||||||||
|
November 2020 |
99.4% |
0.1% |
0.5% |
|||||||||||||||||
|
December 2020 |
99.6% |
0.1% |
0.3% |
|||||||||||||||||
|
January 2021(2) |
99.2% |
0.0% |
0.8% |
|
(1) Customer payments are received daily. The collection information presented is current through February 8, 2021, and the Company anticipates continuing to receive rental payments which will increase the % of Rent Collected. |
|
(2) For comparison, as of February 8, 2021, January rental receipts are slightly higher than the December rental receipts were as of January 8, 2021. |
As of December 31, 2020, Houston, EastGroup's largest market, represented approximately 13.1% of the Company's total portfolio on an annualized base rent basis, and the Company's Houston portfolio was 97.2% leased and 95.9% occupied. As of February 8, 2021, with the exception of two months of 99.5% collections, EastGroup had collected 100% of its 2020 monthly rent for its Houston properties. January 2021 collections are 99.7% as of February 8, 2021.
We believe EastGroup's financial condition and balance sheet remain strong. As of December 31, 2020, the outstanding balance on the Company's $395 million unsecured revolving credit facilities was $125 million, providing $270 million of available capacity. EastGroup has only drawn amounts on its unsecured revolving credit facilities for general corporate purposes in the ordinary course of business. The Company is in compliance with its debt covenants at December 31, 2020 and anticipates remaining in compliance during the foreseeable future. The Company's recent debt and equity activity is described below under Financial Strength and Flexibility.
The Company has been continuing construction on already-active development and value-add projects. During the second and third quarters, EastGroup did not begin construction on any new development projects; and during the fourth quarter, the Company started construction on three new development projects as noted in the Development and Value-Add Properties section of this release. Management will continue to monitor the economic conditions of the Company's markets to determine whether to begin construction on additional future development projects.
The future impacts of COVID-19 on the Company are largely dependent on the severity and duration of the economic uncertainty and its effect on EastGroup's customers and cannot be predicted with certainty at this time.
ACQUISITIONS AND DISPOSITIONS
In October, the Company closed the acquisition of Rancho Distribution Center in the Inland Empire West submarket of Los Angeles. The 162,000 square foot, multi-tenant distribution building was acquired for $27.9 million. The addition of this property brings EastGroup's ownership in Los Angeles, which is currently 100% leased, to 2.5 million square feet of operating and value-add properties.
During December 2020, EastGroup purchased The Rock, a multi-tenant distribution center built in 2019 within the Northeast submarket of Dallas. The property, which contains 212,000 square feet and is currently 100% leased, was purchased for $34.1 million.
Also during December, EastGroup purchased Cherokee 75 Business Center 1, a recently constructed distribution facility which contains 85,000 square feet, for $8.3 million. The 100% leased property is located within an existing 53 acre industrial park in the Northwest submarket of Atlanta.
During December, the Company also acquired 11.3 acres of land in Dallas, known as CreekView Phase 3, for $4.0 million. The Company plans to use this parcel to develop two business distribution buildings containing 145,000 square feet. This project will increase the total square feet of the CreekView 121 park, currently owned by the Company and 99% leased, to 772,000 square feet.
Also, in December 2020, the Company acquired 40.1 acres of development land in McKinney, Texas, within the Northeast submarket of Dallas for $12.2 million. The land, which is near the Company's Allen Station properties, is expected to accommodate the future development of approximately 380,000 square feet across four buildings.
In mid-December, EastGroup acquired 12.7 acres of land in El Paso, Texas for $2.5 million. The land is located adjacent to the Company's Americas Ten Building 1, which is 100% leased, and is expected to accommodate the future development of a 168,000 square foot business distribution building.
Also in December, the Company acquired 11.4 acres of development land in the I-20 West submarket of Atlanta for $1.4 million. EastGroup has future plans to construct a 120,000 square foot building on this site, known as the Blairs Bridge land.
In the aggregate during 2020, EastGroup acquired 347,000 square feet of operating properties for $48.7 million, 162,000 square feet of value-add properties for $27.9 million, and 233 acres of development land for $45.7 million.
Subsequent to year-end, EastGroup purchased Northpoint 200, a recently constructed distribution facility which contains 79,000 square feet, for $6.5 million. The 100% leased property is located within the Northwest submarket of Atlanta, where the Cherokee 75 property acquired in December is located.
Also subsequent to year-end, EastGroup purchased Access Business Park 1, a recently constructed 156,000 square foot building, for $10.3 million. The property, which is 20% leased as of February 8, 2021, is located in the I-385 South submarket in Greenville, South Carolina, near the Company's 385 Business Park buildings, which are 100% leased.
During December 2020, EastGroup sold its joint venture partnership interest in University Business Center 120, a 57,000 square foot research and development building in Santa Barbara, for $10.5 million. EastGroup owned 80%, or 46,000 square feet, of the building through a joint venture arrangement. The sale generated a gain for EastGroup of $6.3 million, which is included in Gain on sales of real estate investments; this gain is excluded from FFO.
Also in December 2020, EastGroup sold Central Green, an 80,000 square foot distribution building in Houston, for $10.5 million. The sale generated a gain of $6.8 million, which is included in Gain on sales of real estate investments; this gain is excluded from FFO.
In total for 2020, EastGroup sold 126,000 square feet of operating properties for $21.0 million, generating gains of $13.1 million, which are included in Gain on sales of real estate investments; these gains are excluded from FFO.
DEVELOPMENT AND VALUE-ADD PROPERTIES
During the fourth quarter of 2020, EastGroup began construction of three new development projects in three different cities. The buildings will contain a total of 577,000 square feet and have projected total costs of $56.1 million. The development projects started during 2020 are detailed in the table below:
|
Development Projects Started in 2020 |
Location |
Size |
Anticipated |
Projected |
|||||||||||||||||||||||||
|
(Square feet) |
(In thousands) |
||||||||||||||||||||||||||||
|
Gateway 4 |
Miami, FL |
197,000 |
06/2021 |
$ |
26,000 |
||||||||||||||||||||||||
|
SunCoast 7 |
Ft. Myers, FL |
77,000 |
11/2021 |
8,700 |
|||||||||||||||||||||||||
|
Gilbert Crossroads C & D |
Phoenix, AZ |
178,000 |
06/2022 |
21,400 |
|||||||||||||||||||||||||
|
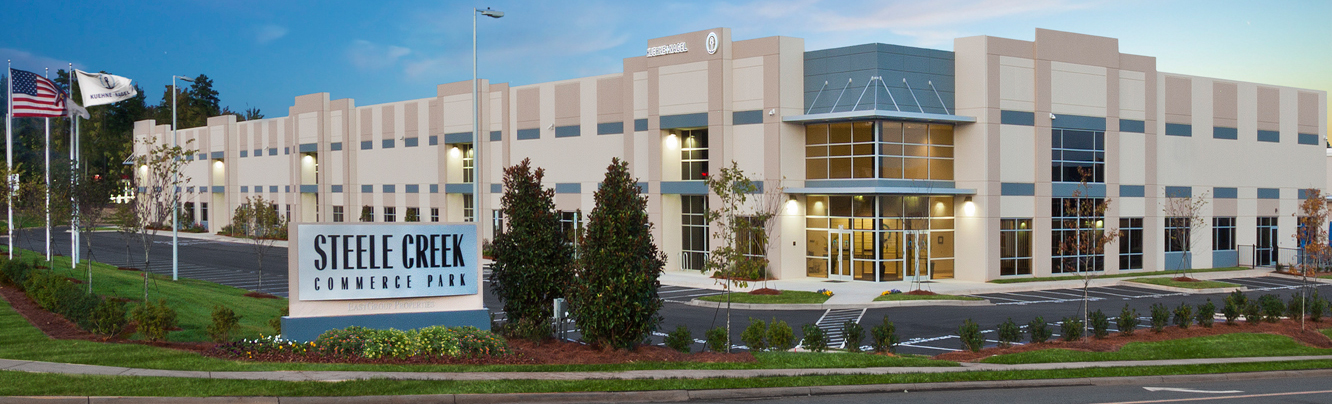
Steele Creek X |
Charlotte, NC |
162,000 |
07/2022 |
12,600 |
|||||||||||||||||||||||||
|
Basswood 1 & 2 |
Dallas, TX |
237,000 |
10/2022 |
22,100 |
|||||||||||||||||||||||||
|
Total Development Projects Started |
851,000 |
$ |
90,800 |
||||||||||||||||||||||||||
At December 31, 2020, EastGroup's development and value-add program consisted of 16 projects (2,741,000 square feet) in 10 cities. The projects, which were collectively 35% leased as of February 8, 2021, have a projected total cost of $291.5 million, of which $65.5 million remained to be spent as of December 31, 2020.
During the fourth quarter of 2020, EastGroup transferred one project to the real estate portfolio (one year after value-add acquisition date). The project, which is located in Las Vegas, contains 196,000 square feet and is 100% leased as of February 8, 2021.
The development and value-add properties transferred to the real estate portfolio during 2020 are detailed in the table below:
|
Development and Value-Add Properties Transferred to the Real Estate Properties Portfolio in 2020 |
Location |
Size |
Conversion |
Cumulative |
Percent |
|||||||||||||||||||||||||||
|
(Square feet) |
(In thousands) |
|||||||||||||||||||||||||||||||
|
Logistics Center 6 & 7 (1) |
Dallas, TX |
142,000 |
01/2020 |
$ |
15,783 |
100% |
||||||||||||||||||||||||||
|
Settlers Crossing 1 |
Austin, TX |
77,000 |
01/2020 |
9,418 |
100% |
|||||||||||||||||||||||||||
|
Settlers Crossing 2 |
Austin, TX |
83,000 |
01/2020 |
8,855 |
100% |
|||||||||||||||||||||||||||
|
Parc North 5 |
Dallas, TX |
100,000 |
02/2020 |
9,115 |
84% |
|||||||||||||||||||||||||||
|
Airport Commerce Center 3 |
Charlotte, NC |
96,000 |
03/2020 |
8,893 |
100% |
|||||||||||||||||||||||||||
|
Horizon VIII & IX |
Orlando, FL |
216,000 |
04/2020 |
18,218 |
100% |
|||||||||||||||||||||||||||
|
Ten West Crossing 8 |
Houston, TX |
132,000 |
04/2020 |
9,836 |
65% |
|||||||||||||||||||||||||||
|
Tri-County Crossing 1 & 2 |
San Antonio, TX |
203,000 |
04/2020 |
16,439 |
100% |
|||||||||||||||||||||||||||
|
SunCoast 8 |
Ft. Myers, FL |
77,000 |
05/2020 |
8,315 |
100% |
|||||||||||||||||||||||||||
|
CreekView 121 5 & 6 |
Dallas, TX |
139,000 |
06/2020 |
15,513 |
100% |
|||||||||||||||||||||||||||
|
Parc North 6 |
Dallas, TX |
96,000 |
07/2020 |
10,768 |
100% |
|||||||||||||||||||||||||||
|
SunCoast 6 |
Ft. Myers, FL |
81,000 |
07/2020 |
8,600 |
100% |
|||||||||||||||||||||||||||
|
Arlington Tech Centre 1 & 2 (1) |
Dallas, TX |
151,000 |
08/2020 |
14,496 |
33% |
|||||||||||||||||||||||||||
|
Gateway 5 |
Miami, FL |
187,000 |
08/2020 |
25,075 |
100% |
|||||||||||||||||||||||||||
|
Steele Creek IX |
Charlotte, NC |
125,000 |
08/2020 |
11,114 |
100% |
|||||||||||||||||||||||||||
|
Grand Oaks 75 2 (1) |
Tampa, FL |
150,000 |
09/2020 |
15,140 |
100% |
|||||||||||||||||||||||||||
|
Rocky Point 2 (1) |
San Diego, CA |
109,000 |
09/2020 |
20,083 |
100% |
|||||||||||||||||||||||||||
|
Southwest Commerce Center (1) |
Las Vegas, NV |
196,000 |
10/2020 |
28,487 |
100% |
|||||||||||||||||||||||||||
|
Total Projects Transferred |
2,360,000 |
$ |
254,148 |
93% |
||||||||||||||||||||||||||||
|
Projected Stabilized Yield (2) |
7.3% |
|||||||||||||||||||||||||||||||
|
(1) These value-add projects were acquired by EastGroup. |
|
(2) Weighted average yield based on property net operating income at 100% occupancy and rents computed on a straight-line basis. |
Subsequent to quarter-end, EastGroup began construction of two development projects. Horizon West 2 & 3 in Orlando will contain 210,000 square feet and have a projected total cost of $18.2 million. Grand Oaks 75 3 in Tampa will contain 136,000 square feet and has a projected total cost of $11.2 million.
DIVIDENDS
EastGroup declared a cash dividend of $0.79 per share in the fourth quarter of 2020. The fourth quarter dividend, which was paid on January 15, 2021, was the Company's 164th consecutive quarterly cash distribution to shareholders. The Company has increased or maintained its dividend for 28 consecutive years and has increased it 25 years over that period, including increases in each of the last nine years. The annualized dividend rate of $3.16 per share yielded 2.2% on the closing stock price of $146.06 on February 8, 2021.
FINANCIAL STRENGTH AND FLEXIBILITY
EastGroup continues to maintain a strong and flexible balance sheet. Debt-to-total market capitalization was 19.3% at December 31, 2020. The Company's interest and fixed charge coverage ratio was 7.24x both for the fourth quarter of 2020 and for the year 2020, and its ratio of debt to earnings before interest, taxes, depreciation and amortization for real estate ("EBITDAre") was 5.16x for the fourth quarter and 5.34x for the year. EBITDAre is a non-GAAP financial measure defined under Definitions later in this release. A reconciliation of Net Income to EBITDAre is presented in the attached schedule "Reconciliations of GAAP to Non-GAAP Measures."
During the fourth quarter, EastGroup issued and sold 122,380 shares of common stock under its continuous common equity offering program at an average price of $140.62 per share, providing aggregate net proceeds to the Company of $16.9 million. During the twelve months ended December 31, 2020, EastGroup issued and sold 709,924 shares of common stock under its continuous common equity program at an average price of $132.32 per share, providing aggregate net proceeds to the Company of $92.7 million.
As previously announced, in July 2020, the Company and a group of lenders agreed to terms on the private placement of $175 million of senior unsecured notes with a weighted average fixed interest rate of 2.65%. The $100 million note has a 10-year term and a fixed interest rate of 2.61%, and the $75 million note has a 12-year term and a fixed interest rate of 2.71%. These maturity dates complement the Company's existing debt maturity schedule. The notes dated August 17, 2020, were issued and sold on October 14, 2020 and require interest-only payments. The notes will not be and have not been registered under the Securities Act of 1933, as amended, and may not be offered or sold in the United States absent registration or an applicable exemption from the registration requirements.
In October 2020, EastGroup repaid (with no penalty) a mortgage loan with a balance of $45.9 million, an interest rate of 4.39% and an original maturity date of January 5, 2021.
Also, in December 2020, the Company repaid a maturing $75 million unsecured term loan with an effective fixed interest rate of 3.45%.
During 2020, the Company closed a total of $275 million in unsecured debt with a weighted average interest rate of 2.56%. Also during 2020, EastGroup repaid maturing unsecured debt totaling $105 million with a weighted average effective fixed interest rate of 3.55% and a maturing mortgage with a principal balance of $45.9 million and an interest rate of 4.39%.
OUTLOOK FOR 2021
EPS for 2021 is estimated to be in the range of $2.52 to $2.62. Estimated FFO per share attributable to common stockholders for 2021 is estimated to be in the range of $5.63 to $5.73. The table below reconciles projected net income attributable to common stockholders to projected FFO. The Company is providing a projection of estimated net income attributable to common stockholders solely to satisfy the disclosure requirements of the U.S. Securities and Exchange Commission.
EastGroup's projections are based on management's current beliefs and assumptions about our business, the industry and the markets in which we operate; there are known and unknown risks and uncertainties associated with these projections. The Company assumes no obligation to update publicly any forward-looking statements, including its outlook for 2021, whether as a result of new information, future events or otherwise. The COVID-19 pandemic has disrupted global, national and local economies and the financial markets; it is difficult to predict the future impact on our business, financial condition, results of operations and cash flows. Please refer to the "Forward-Looking Statements" disclosures included in this earnings release and "Risk Factors" disclosed in our annual and quarterly reports filed with the Securities and Exchange Commission for more information.
|
Low Range |
High Range |
|||||||||||||||||||||||||
|
Q1 2021 |
Y/E 2021 |
Q1 2021 |
Y/E 2021 |
|||||||||||||||||||||||
|
(In thousands, except per share data) |
||||||||||||||||||||||||||
|
Net income attributable to common stockholders |
$ |
23,856 |
101,502 |
25,450 |
105,528 |
|||||||||||||||||||||
|
Depreciation and amortization |
30,840 |
125,363 |
30,840 |
125,363 |
||||||||||||||||||||||
|
Funds from operations attributable to common stockholders |
$ |
54,696 |
226,865 |
56,290 |
230,891 |
|||||||||||||||||||||
|
Diluted shares |
39,861 |
40,262 |
39,861 |
40,262 |
||||||||||||||||||||||
|
Per share data (diluted): |
||||||||||||||||||||||||||
|
Net income attributable to common stockholders |
$ |
0.60 |
2.52 |
0.64 |
2.62 |
|||||||||||||||||||||
|
Funds from operations attributable to common stockholders |
1.37 |
5.63 |
1.41 |
5.73 |
||||||||||||||||||||||
The following assumptions were used for the mid-point:
|
Metrics |
Initial |
Actual for |
|||||||||
|
FFO per share |
$5.63 - $5.73 |
$5.38 |
|||||||||
|
FFO per share increase over prior year |
5.6% |
8.0% |
|||||||||
|
Same PNOI growth: cash basis(1) |
3.5% - 4.5%(2) |
3.2% |
|||||||||
|
Average month-end occupancy |
95.9% - 96.9% |
96.7% |
|||||||||
|
Lease termination fee income |
$585,000 |
$709,000 |
|||||||||
|
Reserves for uncollectible rent (No identified bad debts for 2021) |
$1.8 million |
$2.8 million |
|||||||||
|
Development starts: |
|||||||||||
|
Square feet |
2.0 million |
851,000 |
|||||||||
|
Projected total investment |
$205 million |
$91 million |
|||||||||
|
Value-add property acquisitions (Projected total investment) |
$35 million |
$29 million |
|||||||||
|
Operating property acquisitions |
$30 million |
$49 million |
|||||||||
|
Operating property dispositions (Potential gains on dispositions are not included in the projections) |
$60 million |
$21 million |
|||||||||
|
Unsecured debt closing in period |
$250 million at 2.70% weighted average interest rate |
$275 million at 2.56% weighted average interest rate |
|||||||||
|
Common stock issuances |
$140 million |
$94 million |
|||||||||
|
General and administrative expense |
$16.2 million |
$14.4 million |
|||||||||
|
(1) Excludes straight-line rent adjustments, amortization of market rent intangibles for acquired leases and income from lease terminations. Includes rental income for executed deferral agreements that qualify for the modified COVID-19-related guidance provided by the FASB. |
|
(2) Includes properties which have been in the operating portfolio since 1/1/20 and are projected to be in the operating portfolio through 12/31/21; includes 41,043,000 square feet. |
DEFINITIONS
The Company's chief decision makers use two primary measures of operating results in making decisions: (1) funds from operations attributable to common stockholders ("FFO") and (2) property net operating income ("PNOI"), as defined below.
FFO is computed in accordance with standards established by the National Association of Real Estate Investment Trusts, Inc. ("Nareit"). In December 2018, Nareit issued the "Nareit Funds from Operations White Paper - 2018 Restatement" (the "2018 White Paper"), which reaffirmed, and in some cases refined, Nareit's prior determinations concerning FFO. The guidance in the 2018 White Paper allows preparers an option as it pertains to whether gains or losses on sale, or impairment charges, on real estate assets incidental to a real estate investment trust's ("REIT's") business are excluded from the calculation of FFO. EastGroup has made the election to exclude activity related to such assets that are incidental to our business. The Company has adjusted its 2018 and prior results, as necessary, to reflect this guidance. FFO is calculated as net income (loss) attributable to common stockholders computed in accordance with U.S. generally accepted accounting principles ("GAAP"), excluding gains and losses from sales of real estate property (including other assets incidental to the Company's business) and impairment losses, adjusted for real estate related depreciation and amortization, and after adjustments for unconsolidated partnerships and joint ventures.
FFO Excluding Gain on Casualties and Involuntary Conversion is calculated as FFO (as defined above), adjusted to exclude gain on casualties and involuntary conversion. The Company believes that the exclusion of gain on casualties and involuntary conversion presents a more meaningful comparison of operating performance.
PNOI is defined as Income from real estate operations less Expenses from real estate operations (including market-based internal management fee expense) plus the Company's share of income and property operating expenses from its less-than-wholly-owned real estate investments. EastGroup sometimes refers to PNOI from Same Properties as "Same PNOI" in this press release and the accompanying reconciliation; the Company also presents Same PNOI Excluding Income from Lease Terminations. The Company presents Same PNOI and Same PNOI Excluding Income from Lease Terminations as a property-level supplemental measure of performance used to evaluate the performance of the Company's investments in real estate assets and its operating results on a same property basis. The Company believes it is useful to evaluate Same PNOI Excluding Income from Lease Terminations on both a straight-line and cash basis. The straight-line basis is calculated by averaging the customers' rent payments over the lives of the leases; GAAP requires the recognition of rental income on a straight-line basis. The cash basis excludes adjustments for straight-line rent and amortization of market rent intangibles for acquired leases; cash basis is an indicator of the rents charged to customers by the Company during the periods presented and is useful in analyzing the embedded rent growth in the Company's portfolio. "Same Properties" is defined as operating properties owned during the entire current period and prior year reporting period. Operating properties are stabilized real estate properties (land including building and improvements) that make up the Company's operating portfolio. Properties developed or acquired are excluded from the same property pool until held in the operating portfolio for both the current and prior year reporting periods. Properties sold during the current or prior year reporting periods are also excluded.
FFO and PNOI are supplemental industry reporting measurements used to evaluate the performance of the Company's investments in real estate assets and its operating results. The Company believes that the exclusion of depreciation and amortization in the industry's calculations of PNOI and FFO provides supplemental indicators of the properties' performance since real estate values have historically risen or fallen with market conditions. PNOI and FFO as calculated by the Company may not be comparable to similarly titled but differently calculated measures for other REITs. Investors should be aware that items excluded from or added back to FFO are significant components in understanding and assessing the Company's financial performance.
The Company's chief decision makers also use Earnings Before Interest, Taxes, Depreciation and Amortization for Real Estate ("EBITDAre") in making decisions. EBITDAre is computed in accordance with standards established by Nareit and defined as Net Income, adjusted for gains and losses from sales of real estate investments, non-operating real estate and other assets incidental to the Company's business, interest expense, income tax expense, depreciation and amortization. EBITDAre is a non-GAAP financial measure used to measure the Company's operating performance and its ability to meet interest payment obligations and pay quarterly stock dividends on an unleveraged basis.
EastGroup's chief decision makers also use its Debt-to-EBITDAre ratio, a non-GAAP financial measure calculated by dividing the Company's debt by its EBITDAre, in analyzing the financial condition and operating performance of the Company relative to its leverage.
The Company's interest and fixed charge coverage ratio is a non-GAAP financial measure calculated by dividing the Company's EBITDAre by its interest expense. This ratio provides a basis for analysis of the Company's leverage, operating performance, and its ability to service the interest payments due on its debt.
CONFERENCE CALL
EastGroup will host a conference call and webcast to discuss the results of its fourth quarter and review the Company's current operations on Wednesday, February 10, 2021, at 11:00 a.m. Eastern Time. A live broadcast of the conference call is available by dialing 1-877-876-9173 (conference ID: EastGroup) or by webcast through a link on the Company's website at www.eastgroup.net. If you are unable to listen to the live conference call, a telephone and webcast replay will be available until Wednesday, February 17, 2021. The telephone replay can be accessed by dialing 1-800-723-0488, and the webcast replay can be accessed through a link on the Company's website at www.eastgroup.net.
SUPPLEMENTAL INFORMATION
Supplemental financial information is available under Quarterly Results in the Investor Relations section of the Company's website at www.eastgroup.net or upon request by calling the Company at 601-354-3555.
COMPANY INFORMATION
EastGroup Properties, Inc. (NYSE: EGP), an S&P MidCap 400 company, is a self-administered equity real estate investment trust focused on the development, acquisition and operation of industrial properties in major Sunbelt markets throughout the United States with an emphasis in the states of Florida, Texas, Arizona, California and North Carolina. The Company's goal is to maximize shareholder value by being a leading provider in its markets of functional, flexible and quality business distribution space for location sensitive customers (primarily in the 15,000 to 70,000 square foot range). The Company's strategy for growth is based on ownership of premier distribution facilities generally clustered near major transportation features in supply-constrained submarkets. EastGroup's portfolio, including development projects and value-add acquisitions in lease-up and under construction, currently includes approximately 47 million square feet. EastGroup Properties, Inc. press releases are available on the Company's website at www.eastgroup.net.
FORWARD-LOOKING STATEMENTS
The statements and certain other information contained in this press release, which can be identified by the use of forward-looking terminology such as "may," "will," "seek," "expects," "anticipates," "believes," "targets," "intends," "should," "estimates," "could," "continue," "assume," "projects" or "plans" and variations of such words or similar expressions or the negative of such words, constitute "forward-looking statements" within the meaning of Section 27A of the Securities Act of 1933, as amended, and Section 21E of the Securities Exchange Act of 1934, as amended, and are subject to the safe harbors created thereby. These forward-looking statements reflect the Company's current views about its plans, intentions, expectations, strategies and prospects, which are based on the information currently available to the Company and on assumptions it has made. Although the Company believes that its plans, intentions, expectations, strategies and prospects as reflected in or suggested by those forward-looking statements are reasonable, the Company can give no assurance that such plans, intentions, expectations or strategies will be attained or achieved. Furthermore, these forward-looking statements should be considered as subject to the many risks and uncertainties that exist in the Company's operations and business environment. Such risks and uncertainties could cause actual results to differ materially from those projected. These uncertainties include, but are not limited to:
All forward-looking statements should be read in light of the risks identified in Part I, Item 1A. Risk Factors within the Company's most recent Annual Report on Form 10-K and in its subsequent Quarterly Reports on Form 10-Q.
The Company assumes no obligation to update publicly any forward-looking statements, whether as a result of new information, future events or otherwise.
|
EASTGROUP PROPERTIES, INC. AND SUBSIDIARIES |
||||||||||||||||||||||||||
|
CONSOLIDATED STATEMENTS OF INCOME AND COMPREHENSIVE INCOME |
||||||||||||||||||||||||||
|
(IN THOUSANDS, EXCEPT PER SHARE DATA) |
||||||||||||||||||||||||||
|
(UNAUDITED) |
||||||||||||||||||||||||||
|
Three Months Ended |
Twelve Months Ended |
|||||||||||||||||||||||||
|
December 31, |
December 31, |
|||||||||||||||||||||||||
|
2020 |
2019 |
2020 |
2019 |
|||||||||||||||||||||||
|
REVENUES |
||||||||||||||||||||||||||
|
Income from real estate operations |
$ |
92,592 |
86,480 |
362,669 |
330,813 |
|||||||||||||||||||||
|
Other revenue |
76 |
70 |
354 |
574 |
||||||||||||||||||||||
|
92,668 |
86,550 |
363,023 |
331,387 |
|||||||||||||||||||||||
|
EXPENSES |
||||||||||||||||||||||||||
|
Expenses from real estate operations |
25,863 |
24,294 |
103,368 |
93,274 |
||||||||||||||||||||||
|
Depreciation and amortization |
30,686 |
27,697 |
116,359 |
104,724 |
||||||||||||||||||||||
|
General and administrative |
3,384 |
4,905 |
14,404 |
16,406 |
||||||||||||||||||||||
|
Indirect leasing costs |
139 |
105 |
661 |
411 |
||||||||||||||||||||||
|
60,072 |
57,001 |
234,792 |
214,815 |
|||||||||||||||||||||||
|
OTHER INCOME (EXPENSE) |
||||||||||||||||||||||||||
|
Interest expense |
(8,777) |
(8,249) |
(33,927) |
(34,463) |
||||||||||||||||||||||
|
Gain on sales of real estate investments |
13,145 |
29,662 |
13,145 |
41,068 |
||||||||||||||||||||||
|
Other |
231 |
320 |
942 |
163 |
||||||||||||||||||||||
|
NET INCOME |
37,195 |
51,282 |
108,391 |
123,340 |
||||||||||||||||||||||
|
Net income attributable to noncontrolling interest in joint ventures |
(14) |
(1,673) |
(28) |
(1,678) |
||||||||||||||||||||||
|
NET INCOME ATTRIBUTABLE TO EASTGROUP PROPERTIES, INC. COMMON STOCKHOLDERS |
37,181 |
49,609 |
108,363 |
121,662 |
||||||||||||||||||||||
|
Other comprehensive income (loss) - cash flow hedges |
2,693 |
2,429 |
(13,559) |
(3,894) |
||||||||||||||||||||||
|
TOTAL COMPREHENSIVE INCOME |
$ |
39,874 |
52,038 |
94,804 |
117,768 |
|||||||||||||||||||||
|
BASIC PER COMMON SHARE DATA FOR NET INCOME ATTRIBUTABLE TO EASTGROUP PROPERTIES, INC. COMMON STOCKHOLDERS |
||||||||||||||||||||||||||
|
Net income attributable to common stockholders |
$ |
0.94 |
1.29 |
2.77 |
3.25 |
|||||||||||||||||||||
|
Weighted average shares outstanding |
39,507 |
38,561 |
39,185 |
37,442 |
||||||||||||||||||||||
|
DILUTED PER COMMON SHARE DATA FOR NET INCOME ATTRIBUTABLE TO EASTGROUP PROPERTIES, INC. COMMON STOCKHOLDERS |
||||||||||||||||||||||||||
|
Net income attributable to common stockholders |
$ |
0.94 |
1.28 |
2.76 |
3.24 |
|||||||||||||||||||||
|
Weighted average shares outstanding |
39,653 |
38,687 |
39,296 |
37,527 |
||||||||||||||||||||||
|
EASTGROUP PROPERTIES, INC. AND SUBSIDIARIES |
||||||||||||||||||||||||||
|
RECONCILIATIONS OF GAAP TO NON-GAAP MEASURES |
||||||||||||||||||||||||||
|
(IN THOUSANDS, EXCEPT PER SHARE DATA) |
||||||||||||||||||||||||||
|
(UNAUDITED) |
||||||||||||||||||||||||||
|
Three Months Ended |
Twelve Months Ended |
|||||||||||||||||||||||||
|
December 31, |
December 31, |
|||||||||||||||||||||||||
|
2020 |
2019 |
2020 |
2019 |
|||||||||||||||||||||||
|
NET INCOME ATTRIBUTABLE TO EASTGROUP PROPERTIES, INC. COMMON STOCKHOLDERS |
$ |
37,181 |
49,609 |
108,363 |
121,662 |
|||||||||||||||||||||
|
Depreciation and amortization |
30,686 |
27,697 |
116,359 |
104,724 |
||||||||||||||||||||||
|
Company's share of depreciation from unconsolidated investment |
34 |
35 |
137 |
141 |
||||||||||||||||||||||
|
Depreciation and amortization from noncontrolling interest |
(28) |
(45) |
(142) |
(186) |
||||||||||||||||||||||
|
Gain on sales of real estate investments |
(13,145) |
(29,662) |
(13,145) |
(41,068) |
||||||||||||||||||||||
|
Gain on sales of non-operating real estate |
— |
(83) |
— |
(83) |
||||||||||||||||||||||
|
Noncontrolling interest in gain on sales of real estate investments of consolidated |
— |
1,671 |
— |
1,671 |
||||||||||||||||||||||
|
FUNDS FROM OPERATIONS ("FFO") ATTRIBUTABLE TO COMMON STOCKHOLDERS |
54,728 |
49,222 |
211,572 |
186,861 |
||||||||||||||||||||||
|
Gain on casualties and involuntary conversion |
— |
(80) |
(161) |
(428) |
||||||||||||||||||||||
|
FFO EXCLUDING GAIN ON CASUALTIES AND INVOLUNTARY CONVERSION |
$ |
54,728 |
49,142 |
211,411 |
186,433 |
|||||||||||||||||||||
|
NET INCOME |
$ |
37,195 |
51,282 |
108,391 |
123,340 |
|||||||||||||||||||||
|
Interest expense (1) |
8,777 |
8,249 |
33,927 |
34,463 |
||||||||||||||||||||||
|
Depreciation and amortization |
30,686 |
27,697 |
116,359 |
104,724 |
||||||||||||||||||||||
|
Company's share of depreciation from unconsolidated investment |
34 |
35 |
137 |
141 |
||||||||||||||||||||||
|
EARNINGS BEFORE INTEREST, TAXES, DEPRECIATION AND AMORTIZATION ("EBITDA") |
76,692 |
87,263 |
258,814 |
262,668 |
||||||||||||||||||||||
|
Gain on sales of real estate investments |
(13,145) |
(29,662) |
(13,145) |
(41,068) |
||||||||||||||||||||||
|
Gain on sales of non-operating real estate |
— |
(83) |
— |
(83) |
||||||||||||||||||||||
|
EBITDA for Real Estate ("EBITDAre") |
$ |
63,547 |
57,518 |
245,669 |
221,517 |
|||||||||||||||||||||
|
Debt |
$ |
1,310,895 |
1,182,602 |
1,310,895 |
1,182,602 |
|||||||||||||||||||||
|
Debt-to-EBITDAre ratio |
5.16 |
5.14 |
5.34 |
5.34 |
||||||||||||||||||||||
|
DILUTED PER COMMON SHARE DATA FOR NET INCOME ATTRIBUTABLE TO EASTGROUP PROPERTIES, INC. COMMON STOCKHOLDERS |
||||||||||||||||||||||||||
|
Net income attributable to common stockholders |
$ |
0.94 |
1.28 |
2.76 |
3.24 |
|||||||||||||||||||||
|
FFO attributable to common stockholders |
$ |
1.38 |
1.27 |
5.38 |
4.98 |
|||||||||||||||||||||
|
FFO Excluding Gain on Casualties and Involuntary Conversion attributable to common stockholders |
$ |
1.38 |
1.27 |
5.38 |
4.97 |
|||||||||||||||||||||
|
Weighted average shares outstanding for EPS and FFO purposes |
39,653 |
38,687 |
39,296 |
37,527 |
||||||||||||||||||||||
|
(1) Net of capitalized interest of $2,089 and $2,386 for the three months ended December 31, 2020 and 2019, respectively; and $9,651 and $8,453 for the twelve months ended December 31, 2020 and 2019, respectively. |
||||||||||||||||||||||||||
|
EASTGROUP PROPERTIES, INC. AND SUBSIDIARIES |
||||||||||||||||||||||||||
|
RECONCILIATIONS OF GAAP TO NON-GAAP MEASURES (Continued) |
||||||||||||||||||||||||||
|
(IN THOUSANDS) |
||||||||||||||||||||||||||
|
(UNAUDITED) |
||||||||||||||||||||||||||
|
Three Months Ended |
Twelve Months Ended |
|||||||||||||||||||||||||
|
December 31, |
December 31, |
|||||||||||||||||||||||||
|
2020 |
2019 |
2020 |
2019 |
|||||||||||||||||||||||
|
NET INCOME |
$ |
37,195 |
51,282 |
108,391 |
123,340 |
|||||||||||||||||||||
|
Gain on sales of real estate investments |
(13,145) |
(29,662) |
(13,145) |
(41,068) |
||||||||||||||||||||||
|
Gain on sales of non-operating real estate |
— |
(83) |
— |
(83) |
||||||||||||||||||||||
|
Net loss on other |
— |
— |
— |
884 |
||||||||||||||||||||||
|
Interest income |
(15) |
(28) |
(101) |
(129) |
||||||||||||||||||||||
|
Other revenue |
(76) |
(70) |
(354) |
(574) |
||||||||||||||||||||||
|
Indirect leasing costs |
139 |
105 |
661 |
411 |
||||||||||||||||||||||
|
Depreciation and amortization |
30,686 |
27,697 |
116,359 |
104,724 |
||||||||||||||||||||||
|
Company's share of depreciation from unconsolidated investment |
34 |
35 |
137 |
141 |
||||||||||||||||||||||
|
Interest expense (1) |
8,777 |
8,249 |
33,927 |
34,463 |
||||||||||||||||||||||
|
General and administrative expense (2) |
3,384 |
4,905 |
14,404 |
16,406 |
||||||||||||||||||||||
|
Noncontrolling interest in PNOI of consolidated joint ventures |
(41) |
(62) |
(171) |
(199) |
||||||||||||||||||||||
|
PROPERTY NET OPERATING INCOME ("PNOI") |
66,938 |
62,368 |
260,108 |
238,316 |
||||||||||||||||||||||
|
PNOI from 2019 and 2020 Acquisitions |
(2,065) |
(1,434) |
(8,434) |
(2,929) |
||||||||||||||||||||||
|
PNOI from 2019 and 2020 Development and Value-Add Properties |
(7,494) |
(3,680) |
(24,050) |
(8,109) |
||||||||||||||||||||||
|
PNOI from 2019 and 2020 Operating Property Dispositions |
(255) |
(950) |
(1,081) |
(4,787) |
||||||||||||||||||||||
|
Other PNOI |
87 |
68 |
257 |
247 |
||||||||||||||||||||||
|
SAME PNOI (Straight-Line Basis) |
57,211 |
56,372 |
226,800 |
222,738 |
||||||||||||||||||||||
|
Net lease termination fee income from same properties |
(48) |
(317) |
(709) |
(1,258) |
||||||||||||||||||||||
|
SAME PNOI EXCLUDING INCOME FROM LEASE TERMINATIONS (Straight-Line Basis) |
57,163 |
56,055 |
226,091 |
221,480 |
||||||||||||||||||||||
|
Straight-line rent adjustments for same properties |
374 |
261 |
1,361 |
(867) |
||||||||||||||||||||||
|
Acquired leases - market rent adjustment amortization for same properties |
(134) |
(170) |
(583) |
(730) |
||||||||||||||||||||||
|
SAME PNOI EXCLUDING INCOME FROM LEASE TERMINATIONS (Cash Basis) |
$ |
57,403 |
56,146 |
226,869 |
219,883 |
|||||||||||||||||||||
|
(1) Net of capitalized interest of $2,089 and $2,386 for the three months ended December 31, 2020 and 2019, respectively; and $9,651 and $8,453 for the twelve months ended December 31, 2020 and 2019, respectively. |
||||||||||||||||||||||||||
|
(2) Net of capitalized development costs of $1,637 and $2,121 for the three months ended December 31, 2020 and 2019, respectively; and $6,689 and $6,918 for the twelve months ended December 31, 2020 and 2019, respectively. |
||||||||||||||||||||||||||
![]() View original content to download multimedia:http://www.prnewswire.com/news-releases/eastgroup-properties-announces-fourth-quarter-and-year-2020-results-301225312.html
View original content to download multimedia:http://www.prnewswire.com/news-releases/eastgroup-properties-announces-fourth-quarter-and-year-2020-results-301225312.html
SOURCE EastGroup Properties