JACKSON, Miss., April 20, 2016 /PRNewswire/ --

EastGroup Properties, Inc. (NYSE: EGP) announced today the results of its operations for the three months ended March 31, 2016.
Commenting on EastGroup's performance, Marshall Loeb, CEO, stated, "First quarter saw a continued growth in funds from operations with a 4.6% increase in FFO per share versus the same quarter last year. We have now achieved FFO per share increases as compared to the previous year's quarter in nineteen of the last twenty quarters. Helping to fuel this trend is occupancy, which again came in above 95% for the eleventh consecutive quarter.
"Outside of operations, we've made solid progress recycling capital and laying the groundwork to continue the pace into the second quarter. Selling our older, non-core Houston assets creates further geographic diversification within our portfolio while generating funds for the development pipeline."
FUNDS FROM OPERATIONS
For the quarter ended March 31, 2016, funds from operations (FFO) attributable to common stockholders were $.91 per share compared to $.87 per share for the same quarter of 2015, an increase of 4.6%. Property net operating income (PNOI) increased by $2,618,000, or 6.4%, during the quarter ended March 31, 2016, compared to the same period of 2015. PNOI increased $1,433,000 from newly developed and redeveloped properties, $868,000 from same property operations and $587,000 from 2015 acquisitions; PNOI decreased $250,000 from properties sold in 2015 and 2016.
Same PNOI increased 2.2% for the quarter ended March 31, 2016, compared to the same quarter in 2015; without straight-line rent adjustments, same PNOI increased 1.8%. Rental rates on new and renewal leases (6.8% of total square footage) increased an average of 16.5% for the quarter; rental rates increased 6.8% without straight-line rent adjustments.
FFO and PNOI are non-GAAP financial measures, which are defined under Definitions later in this release. Reconciliations of Net Income to PNOI and Net Income Attributable to EastGroup Properties, Inc. Common Stockholders to FFO are presented in the attached schedule "Reconciliations of GAAP to Non-GAAP Measures."
EARNINGS PER SHARE
On a diluted per share basis, earnings per common share (EPS) was $.67 and $.31 for the three months ended March 31, 2016 and 2015, respectively. EPS for the three months ended March 31, 2016 included gains on sales of real estate investments and non-operating real estate of $11,342,000 ($.35 per share); EPS for the same period of 2015 included gains on sales of non-operating real estate of $123,000 (less than $.01 per share).
SALES
EastGroup sold the following operating properties during the first quarter of 2016:
|
Properties Sold in First Quarter 2016 |
Date of Sale |
Size |
Gross Sales Proceeds |
Realized Gain |
||||||||
|
(Square feet) |
(In thousands) |
|||||||||||
|
Northwest Point Distribution and Service Centers, |
02/12/2016 |
232,000 |
$ |
15,550 |
10,109 |
|||||||
|
North Stemmons III, Dallas, TX |
03/04/2016 |
60,000 |
3,300 |
1,223 |
||||||||
|
Total Properties Sold in First Quarter 2016 |
292,000 |
$ |
18,850 |
11,332 |
||||||||
The gains on sales of the Northwest Point Distribution and Service Centers and North Stemmons III were not included in FFO.
Also in the first quarter, EastGroup sold a small parcel of land (1.2 acres) adjacent to its Horizon Commerce Park in Orlando for $673,000. The Company recognized a gain of $10,000 which was included in FFO.
Subsequent to quarter-end, EastGroup sold the following operating properties:
|
Properties Sold in April 2016 |
Size |
Gross Sales |
||||||
|
(Square feet) |
(In thousands) |
|||||||
|
North Stemmons II, Dallas, TX |
26,000 |
$ |
1,300 |
|||||
|
Lockwood Distribution Center, Houston, TX |
392,000 |
14,325 |
||||||
|
West Loop Distribution Center 1 & 2, Houston, TX |
161,000 |
13,500 |
||||||
|
Total Properties Sold in April 2016 |
579,000 |
$ |
29,125 |
|||||
The Company expects to record gains on the sales of North Stemmons II, Lockwood Distribution Center and West Loop Distribution Center 1 & 2 in the second quarter; these gains will not be included in FFO.
Also subsequent to quarter-end, the Company sold 3.9 acres of land adjacent to its Valwood Distribution Center in Dallas for $644,000. The Company expects to record a gain on sale of approximately $135,000 in the second quarter which will be included in FFO.
Without the PNOI from the Houston properties sold, Houston PNOI for the first quarter would be reduced from 20.2% to 19.0% of total PNOI.
DEVELOPMENT
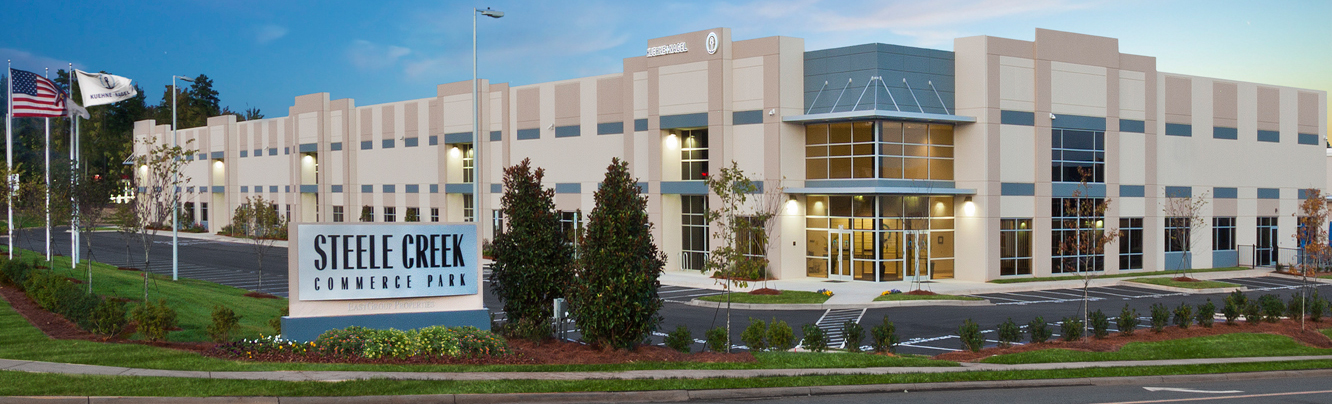
EastGroup continued to expand its Steele Creek Commerce Park in Charlotte by acquiring 47.9 acres of development land for $3.9 million. The land, which will accommodate the future development of approximately 475,000 square feet of business distribution buildings, was acquired in separate transactions closing on February 25 and March 23, 2016.
EastGroup began construction of three development projects during the first quarter of 2016: Madison IV & V, two multi-tenant business distribution buildings containing a combined 145,000 square feet in Tampa; Alamo Ridge IV, a 97,000 square foot multi-tenant business distribution building in San Antonio; and CreekView 1 & 2, two multi-tenant business distribution buildings containing a combined 193,000 square feet in Dallas.
These development projects, which were started during the first quarter, are detailed in the table below.
|
Development Properties Started in 2016 |
Size |
Anticipated |
Projected |
|||||||
|
(Square feet) |
(In thousands) |
|||||||||
|
Alamo Ridge IV, San Antonio, TX |
97,000 |
10/2017 |
$ |
6,000 |
||||||
|
Madison IV & V, Tampa, FL |
145,000 |
10/2017 |
9,400 |
|||||||
|
CreekView 1 & 2, Dallas, TX |
193,000 |
12/2017 |
16,700 |
|||||||
|
Total Development Properties Started |
435,000 |
$ |
32,100 |
|||||||
At March 31, 2016, EastGroup's development program consisted of 13 projects (1,737,000 square feet). The projects, which were collectively 37% leased as of April 19, 2016, have a projected total cost of $124 million with approximately $52 million remaining to be invested as of March 31, 2016.
During the first quarter of 2016, EastGroup transferred (at the earlier of 80% occupied or one year after completion) four development properties to the real estate portfolio as detailed in the table below.
|
Development Properties Transferred to Real Estate |
Size |
Conversion |
Cumulative |
Percent |
|||||||
|
(Square feet) |
(In thousands) |
||||||||||
|
Alamo Ridge I, San Antonio, TX |
96,000 |
02/2016 |
$ |
7,577 |
68% |
||||||
|
Alamo Ridge II, San Antonio, TX |
62,000 |
02/2016 |
4,189 |
100% |
|||||||
|
Madison II & III, Tampa, FL |
127,000 |
02/2016 |
7,459 |
95% |
|||||||
|
West Road III, Houston, TX |
78,000 |
03/2016 |
4,842 |
0% |
|||||||
|
Total Properties Transferred |
363,000 |
$ |
24,067 |
68% |
|||||||
Subsequent to quarter-end, EastGroup started construction of Horizon VII, a 109,000 square foot multi-tenant business distribution building in Orlando. The Company expects this project, which has estimated total costs of $8.0 million, to be completed during fourth quarter 2016.
DIVIDENDS
EastGroup paid cash dividends of $.60 per share in the first quarter of 2016, which was the Company's 145th consecutive quarterly cash distribution. EastGroup has increased or maintained its dividend for 23 consecutive years and increased it 20 years during that period. The Company has also increased the dividend in each of the last four years. The Company's payout ratio of dividends to FFO was 66% for the first quarter. The annualized dividend rate of $2.40 per share yielded 3.9% on the closing stock price of $61.28 on April 19, 2016.
FINANCIAL STRENGTH AND FLEXIBILITY
EastGroup continues to maintain a strong and flexible balance sheet. Debt-to-total market capitalization was 34.7% at March 31, 2016. For the first quarter, the Company had both interest and fixed charge coverage ratios of 4.3x and a debt to earnings before interest, taxes, depreciation and amortization (EBITDA) ratio of 6.7x.
Total debt at March 31, 2016 was $1.04 billion comprised of $528.3 million of unsecured debt, $345.4 million of secured debt, and $165.8 million of unsecured bank credit facilities. Please note the Company adopted Financial Accounting Standards Board Accounting Standards Update 2015-03, Simplifying the Presentation of Debt Issuance Costs, effective January 1, 2016. As a result, debt on the Company's Balance Sheet is now presented net of loan costs.
In February, EastGroup executed a commitment letter for a $65 million senior unsecured term loan which closed on April 1, 2016. The loan has a seven-year term and interest only payments. It bears interest at the annual rate of LIBOR plus an applicable margin (currently 1.65%) based on the Company's senior unsecured long-term debt rating. The Company also entered into an interest rate swap agreement to convert the loan's LIBOR rate component to a fixed interest rate for the entire term of the loan providing a total effective fixed interest rate of 2.863%.
In March, Moody's Investors Service affirmed EastGroup's issuer rating of Baa2 with a stable outlook.
OUTLOOK FOR 2016
FFO per share attributable to common stockholders for 2016 is now estimated to be in the range of $3.94 to $4.04. The Company increased the mid-point from $3.98 to $3.99. EPS for 2016 is estimated to be in the range of $1.96 to $2.06. The table below reconciles projected net income attributable to common stockholders to projected FFO.
|
Low Range |
High Range |
||||||||||||
|
Q2 2016 |
Y/E 2016 |
Q2 2016 |
Y/E 2016 |
||||||||||
|
(In thousands, except per share data) |
|||||||||||||
|
Net income attributable to common stockholders |
$ |
12,606 |
63,326 |
13,254 |
66,562 |
||||||||
|
Depreciation and amortization |
18,880 |
75,533 |
18,880 |
75,533 |
|||||||||
|
Gain on sales of real estate investments |
— |
(11,332) |
— |
(11,332) |
|||||||||
|
Funds from operations attributable to common |
$ |
31,486 |
127,527 |
32,134 |
130,763 |
||||||||
|
Diluted shares |
32,354 |
32,361 |
32,354 |
32,361 |
|||||||||
|
Per share data (diluted): |
|||||||||||||
|
Net income attributable to common stockholders |
$ |
0.39 |
1.96 |
0.41 |
2.06 |
||||||||
|
Funds from operations attributable to common |
$ |
0.97 |
3.94 |
0.99 |
4.04 |
||||||||
The following assumptions were used for the mid-point:
|
Metrics |
Guidance for Q2 2016 |
Revised Guidance for Year 2016 |
Initial Guidance for Year 2016 |
Actual for Year 2015 |
||||
|
FFO per share |
$.98 |
$3.99 |
$3.98 |
$3.67 |
||||
|
FFO per share increase over prior year period |
6.8% |
8.7% |
8.5% |
5.8% |
||||
|
Same Property Net Operating Income (PNOI) |
||||||||
|
GAAP |
2.3% |
3.2% |
2.8% |
2.0% |
||||
|
GAAP without termination fees |
2.1% |
3.0% |
2.7% |
2.7% |
||||
|
Without straight-line rent adjustments |
2.7% |
3.0% |
2.8% |
2.4% |
||||
|
Without straight-line rent adjustments and |
2.4% |
2.8% |
2.6% |
3.4% |
||||
|
Average month-end occupancy |
95.1% |
95.6% |
95.6% |
96.0% |
||||
|
Lease termination fee income |
$126,000 |
$553,000 |
$401,000 |
$225,000 |
||||
|
Bad debt expense |
$280,000 |
$964,000 |
$1,120,000 |
$747,000 |
||||
|
Development starts: |
||||||||
|
Square feet |
266,000 |
1.2 million |
1.2 million |
1.3 million |
||||
|
Projected total investment |
$18 million |
$95 million |
$95 million |
$87 million |
||||
|
Operating property acquisitions |
None |
$25 million |
$50 million |
$32 million |
||||
|
Operating property dispositions included in |
$54 million |
$90 million |
$85 million |
$5 million |
||||
|
Average variable interest rate on unsecured |
1.4% |
1.5% |
1.5% |
1.4% |
||||
|
Unsecured debt closing in period |
$65 million at 2.863% on 4/1/16 |
$140 million total ($65 million on 4/1/16 at 2.863% and $75 million at 4.25% in Q4 2016) |
$165 million total ($65 million in Q1 2016 at 3.5% and $100 million at 4.25% in Q3 2016) |
$150 million at 3.5% |
||||
|
Common stock issuances |
None |
None |
None |
$6.2 million |
||||
|
General and administrative expense |
$2.8 million |
$13.2 million |
$12.8 million |
$15.1 million |
||||
DEFINITIONS
The Company's chief decision makers use two primary measures of operating results in making decisions: (1) property net operating income (PNOI), defined as Income from real estate operations less Expenses from real estate operations (including market-based internal management fee expense) plus the Company's share of income and property operating expenses from its less-than-wholly-owned real estate investments, and (2) funds from operations attributable to common stockholders (FFO). EastGroup defines FFO consistent with the National Association of Real Estate Investment Trusts' definition, as net income (loss) attributable to common stockholders computed in accordance with U.S. generally accepted accounting principles (GAAP), excluding gains or losses from sales of depreciable real estate property and impairment losses, plus real estate related depreciation and amortization, and after adjustments for unconsolidated partnerships and joint ventures.
PNOI and FFO are supplemental industry reporting measurements used to evaluate the performance of the Company's investments in real estate assets and its operating results. The Company believes that the exclusion of depreciation and amortization in the industry's calculations of PNOI and FFO provides supplemental indicators of the properties' performance since real estate values have historically risen or fallen with market conditions. PNOI and FFO as calculated by the Company may not be comparable to similarly titled but differently calculated measures for other REITs. Investors should be aware that items excluded from or added back to FFO are significant components in understanding and assessing the Company's financial performance.
CONFERENCE CALL
EastGroup will host a conference call and webcast to discuss the results of its first quarter and review the Company's current operations on Thursday, April 21, 2016, at 11:00 a.m. Eastern Daylight Time. A live broadcast of the conference call is available by dialing 1-877-876-9177 (conference ID: EastGroup) or by webcast through a link on the Company's website at eastgroup.net. If you are unable to listen to the live conference call, a telephone and webcast replay will be available on Thursday, April 21, 2016. The telephone replay will be available until Thursday, April 28, 2016, and can be accessed by dialing 1-800-374-1375. Also, the replay of the webcast can be accessed through a link on the Company's website at eastgroup.net and will be available until Thursday, April 28, 2016.
SUPPLEMENTAL INFORMATION
Supplemental financial information is available in the Reports section of the Company's website at eastgroup.net or upon request by calling the Company at 601-354-3555.
COMPANY INFORMATION
EastGroup Properties, Inc. is a self-administered equity real estate investment trust focused on the development, acquisition and operation of industrial properties in major Sunbelt markets throughout the United States with an emphasis in the states of Florida, Texas, Arizona, California and North Carolina. The Company's goal is to maximize shareholder value by being the leading provider in its markets of functional, flexible, and quality business distribution space (primarily in the 5,000 to 50,000 square foot range) for location sensitive customers. The Company's strategy for growth is based on ownership of premier distribution facilities generally clustered near major transportation features in supply-constrained submarkets. EastGroup's portfolio, including development projects in lease-up and under construction, currently includes 36.2 million square feet. EastGroup Properties, Inc. press releases are available on the Company's website at eastgroup.net.
FORWARD-LOOKING STATEMENTS
The Company's assumptions and financial projections in this release are based upon "forward-looking" information and are being made pursuant to the safe harbor provisions of the Private Securities Litigation Reform Act of 1995. Words such as "will," "anticipates," "expects," "believes," "intends," "plans," "seeks," "estimates," variations of such words and similar expressions are intended to identify such forward-looking statements, which generally are not historical in nature. All statements that address operating performance, events or developments that the Company expects or anticipates will occur in the future, including statements relating to rent and occupancy growth, development activity, the acquisition or sale of properties, general conditions in the geographic areas where the Company operates and the availability of capital, are forward-looking statements. Forward-looking statements are inherently subject to known and unknown risks and uncertainties, many of which the Company cannot predict, including, without limitation:
Although the Company believes that the expectations reflected in the forward-looking statements are based upon reasonable assumptions at the time made, the Company can give no assurance that such expectations will be achieved. The Company assumes no obligation whatsoever to publicly update or revise any forward-looking statements. See also the information contained in the Company's reports filed or to be filed from time to time with the Securities and Exchange Commission pursuant to the Securities Exchange Act of 1934, as amended.
|
EASTGROUP PROPERTIES, INC. AND SUBSIDIARIES |
|||||||
|
CONSOLIDATED STATEMENTS OF INCOME AND COMPREHENSIVE INCOME |
|||||||
|
(IN THOUSANDS, EXCEPT PER SHARE DATA) |
|||||||
|
(UNAUDITED) |
|||||||
|
Three Months Ended |
|||||||
|
March 31, |
|||||||
|
2016 |
2015 |
||||||
|
REVENUES |
|||||||
|
Income from real estate operations |
$ |
61,568 |
57,575 |
||||
|
Other income |
21 |
17 |
|||||
|
61,589 |
57,592 |
||||||
|
EXPENSES |
|||||||
|
Expenses from real estate operations |
17,820 |
16,413 |
|||||
|
Depreciation and amortization |
19,162 |
18,142 |
|||||
|
General and administrative |
5,312 |
4,538 |
|||||
|
42,294 |
39,093 |
||||||
|
OPERATING INCOME |
19,295 |
18,499 |
|||||
|
OTHER INCOME (EXPENSE) |
|||||||
|
Interest expense |
(9,065) |
(8,805) |
|||||
|
Gain on sales of real estate investments |
11,332 |
— |
|||||
|
Other |
268 |
367 |
|||||
|
NET INCOME |
21,830 |
10,061 |
|||||
|
Net income attributable to noncontrolling interest in joint ventures |
(119) |
(131) |
|||||
|
NET INCOME ATTRIBUTABLE TO EASTGROUP PROPERTIES, INC. COMMON STOCKHOLDERS |
21,711 |
9,930 |
|||||
|
Other comprehensive loss - cash flow hedges |
(5,397) |
(2,535) |
|||||
|
TOTAL COMPREHENSIVE INCOME |
$ |
16,314 |
7,395 |
||||
|
BASIC PER COMMON SHARE DATA FOR NET INCOME ATTRIBUTABLE TO EASTGROUP |
|||||||
|
Net income attributable to common stockholders |
$ |
0.67 |
0.31 |
||||
|
Weighted average shares outstanding |
32,254 |
32,032 |
|||||
|
DILUTED PER COMMON SHARE DATA FOR NET INCOME ATTRIBUTABLE TO EASTGROUP |
|||||||
|
Net income attributable to common stockholders |
$ |
0.67 |
0.31 |
||||
|
Weighted average shares outstanding |
32,307 |
32,109 |
|||||
|
EASTGROUP PROPERTIES, INC. AND SUBSIDIARIES |
||||||||
|
RECONCILIATIONS OF GAAP TO NON-GAAP MEASURES |
||||||||
|
(IN THOUSANDS, EXCEPT PER SHARE DATA) |
||||||||
|
(UNAUDITED) |
||||||||
|
Three Months Ended |
||||||||
|
March 31, |
||||||||
|
2016 |
2015 |
|||||||
|
NET INCOME |
$ |
21,830 |
10,061 |
|||||
|
Gain on sales of real estate investments |
(11,332) |
— |
||||||
|
Gain on sales of non-operating real estate |
(10) |
(123) |
||||||
|
Interest income |
(64) |
(65) |
||||||
|
Other income |
(21) |
(17) |
||||||
|
Interest rate swap ineffectiveness |
5 |
— |
||||||
|
Depreciation and amortization |
19,162 |
18,142 |
||||||
|
Company's share of depreciation from unconsolidated investment |
31 |
29 |
||||||
|
Interest expense (1) |
9,065 |
8,805 |
||||||
|
General and administrative expense (2) |
5,312 |
4,538 |
||||||
|
Noncontrolling interest in PNOI of consolidated 80% joint ventures |
(201) |
(211) |
||||||
|
PROPERTY NET OPERATING INCOME (PNOI) |
$ |
43,777 |
41,159 |
|||||
|
COMPONENTS OF PNOI: |
||||||||
|
PNOI from Same Properties |
$ |
40,931 |
40,063 |
|||||
|
PNOI from 2015 Acquisitions |
587 |
— |
||||||
|
PNOI from 2015 and 2016 Development and Redevelopment Properties |
2,200 |
767 |
||||||
|
PNOI from 2015 and 2016 Dispositions |
117 |
367 |
||||||
|
Other PNOI |
(58) |
(38) |
||||||
|
TOTAL PNOI |
$ |
43,777 |
41,159 |
|||||
|
NET INCOME ATTRIBUTABLE TO EASTGROUP PROPERTIES, INC. COMMON STOCKHOLDERS |
$ |
21,711 |
9,930 |
|||||
|
Depreciation and amortization |
19,162 |
18,142 |
||||||
|
Company's share of depreciation from unconsolidated investment |
31 |
29 |
||||||
|
Depreciation and amortization from noncontrolling interest |
(54) |
(50) |
||||||
|
Gain on sales of real estate investments |
(11,332) |
— |
||||||
|
FUNDS FROM OPERATIONS (FFO) ATTRIBUTABLE TO COMMON STOCKHOLDERS |
$ |
29,518 |
28,051 |
|||||
|
NET INCOME |
$ |
21,830 |
10,061 |
|||||
|
Interest expense (1) |
9,065 |
8,805 |
||||||
|
Depreciation and amortization |
19,162 |
18,142 |
||||||
|
Company's share of depreciation from unconsolidated investment |
31 |
29 |
||||||
|
Gain on sales of real estate investments |
(11,332) |
— |
||||||
|
EARNINGS BEFORE INTEREST, TAXES, DEPRECIATION AND AMORTIZATION (EBITDA) |
$ |
38,756 |
37,037 |
|||||
|
DILUTED PER COMMON SHARE DATA FOR NET INCOME ATTRIBUTABLE TO EASTGROUP PROPERTIES, INC. |
||||||||
|
Net income attributable to common stockholders |
$ |
0.67 |
0.31 |
|||||
|
Funds from operations (FFO) attributable to common stockholders |
$ |
0.91 |
0.87 |
|||||
|
Weighted average shares outstanding for EPS and FFO purposes |
32,307 |
32,109 |
||||||
|
(1) Net of capitalized interest of $1,162 and $1,179 for the three months ended March 31, 2016 and 2015, respectively. |
||||||||
|
(2) Net of capitalized development costs of $891 and $927 for the three months ended March 31, 2016 and 2015, respectively. |
||||||||
Logo - http://photos.prnewswire.com/prnh/20030519/EGPLOGO
To view the original version on PR Newswire, visit:http://www.prnewswire.com/news-releases/eastgroup-properties-announces-first-quarter-2016-results-300254921.html
SOURCE EastGroup Properties, Inc.